Faster Spark Was the Goal. A Simpler Spark Came with It: Part 2



Data Skew Without the Tax
In the first part of this series, we looked at disk spills and OOM exceptions - what happens when an executor runs out of memory. Data skew showed up there as one of the main triggers: one task receives far more data than the others, runs out of its share of memory, and either spills to disk or throws an exception.
But spilling is only one symptom. Data skew carries a bigger risk than that. This is where Spark's execution model - split the data into partitions, run many tasks in parallel, and wait for them to finish all at the end of each stage - meets what real data looks like.
And real data is not well behaved. One key can carry millions of rows while most keys carry a handful.
The hard part isn't that some data is larger. More data taking longer to process is expected. The hard part is that in standard Spark, skew doesn't just make a query slower. It changes how the executor behaves: it creates long-running tasks, leaves hundreds of cores idle waiting on the few that keep the stage open and makes performance difficult to predict or tune.
This post is about why that happens, and why the same skewed data is much less of a problem on DualBird's dedicated hardware (FPGA) architecture.
How Spark executes a stage
Spark splits a dataset into partitions and runs one task per partition. Inside an executor - a JVM with a fixed amount of memory and a set of CPU slots - many of those tasks run concurrently, and they all share one execution memory pool. Spark gives each running task roughly 1/N of that pool, where N is how many tasks are running, no matter how much data any one of them is holding. In Part 1 we explain this memory model - and where it breaks.
Two more properties of Spark's execution model become important when data skew is involved. First, many shuffle-heavy operators must co-locate rows with the same “hot” key on the shuffle-read side, which means the hot key cannot be distributed across tasks easily, without fundamentally restructuring the query strategy. Second, a stage does not conclude until its very last task does, so everything downstream is blocked waiting for that one slow task. Put those together and you can already see the trap:
- Memory is linearly divided by the number of tasks, regardless of how much data each task holds.
- All rows with the same hot key are typically concentrated in a single shuffle-read task unless the query is explicitly rewritten to split them.
- When the skew is substantial enough, the stage moves at the speed of its slowest task.
Together, they explain why Spark data skew is so costly.
What skew does to Spark
Data skew is not a single failure mode. It's a hidden property of the data, which surfaces in three distinct ways.
This blog post is about hot-key skew: some distinct keys appear in more rows than the average key. This post is not about high cardinality - many distinct keys, rather than a few dominant ones - which is a different problem with its own failure modes. We will discuss data cardinality in future blog posts.
1. Memory spills
The skewed task has far more data to process than the others. But it doesn't get extra memory for it - it still gets its 1/N slice of the shared pool. When the data it's holding doesn't fit in that slice, Spark spills it to disk. We covered exactly this in Part 1.
2. Stragglers
A stage does not conclude until its last task is done. So when most tasks finish quickly but one contains all the rows associated with the same hot key, the entire stage waits for that single task to finish - not because it landed on a slow machine, but because it genuinely has more work to do than its peers, and outside of AQE's skew join optimization, which covers joins only, the execution path has no mechanism to distribute a single hot key across multiple tasks.
The effects compound. The skewed task occupies an executor slot for longer, holds its memory share for longer, and drags garbage collection, buffering, and scheduling along with it. The penalty is twofold: the task has genuinely more work to do, and the executor ends up spending a disproportionate amount of time around that one outlier.
The result is the Spark UI pattern everyone recognizes: a long flat tail at the end of a stage, where most tasks have long finished, yet one or two are still running, holding up everything downstream.
3. The tuning trap
What makes data skews particularly difficult to manage is that the levers you reach to improve throughput are the same levers that alter how the skews manifest:
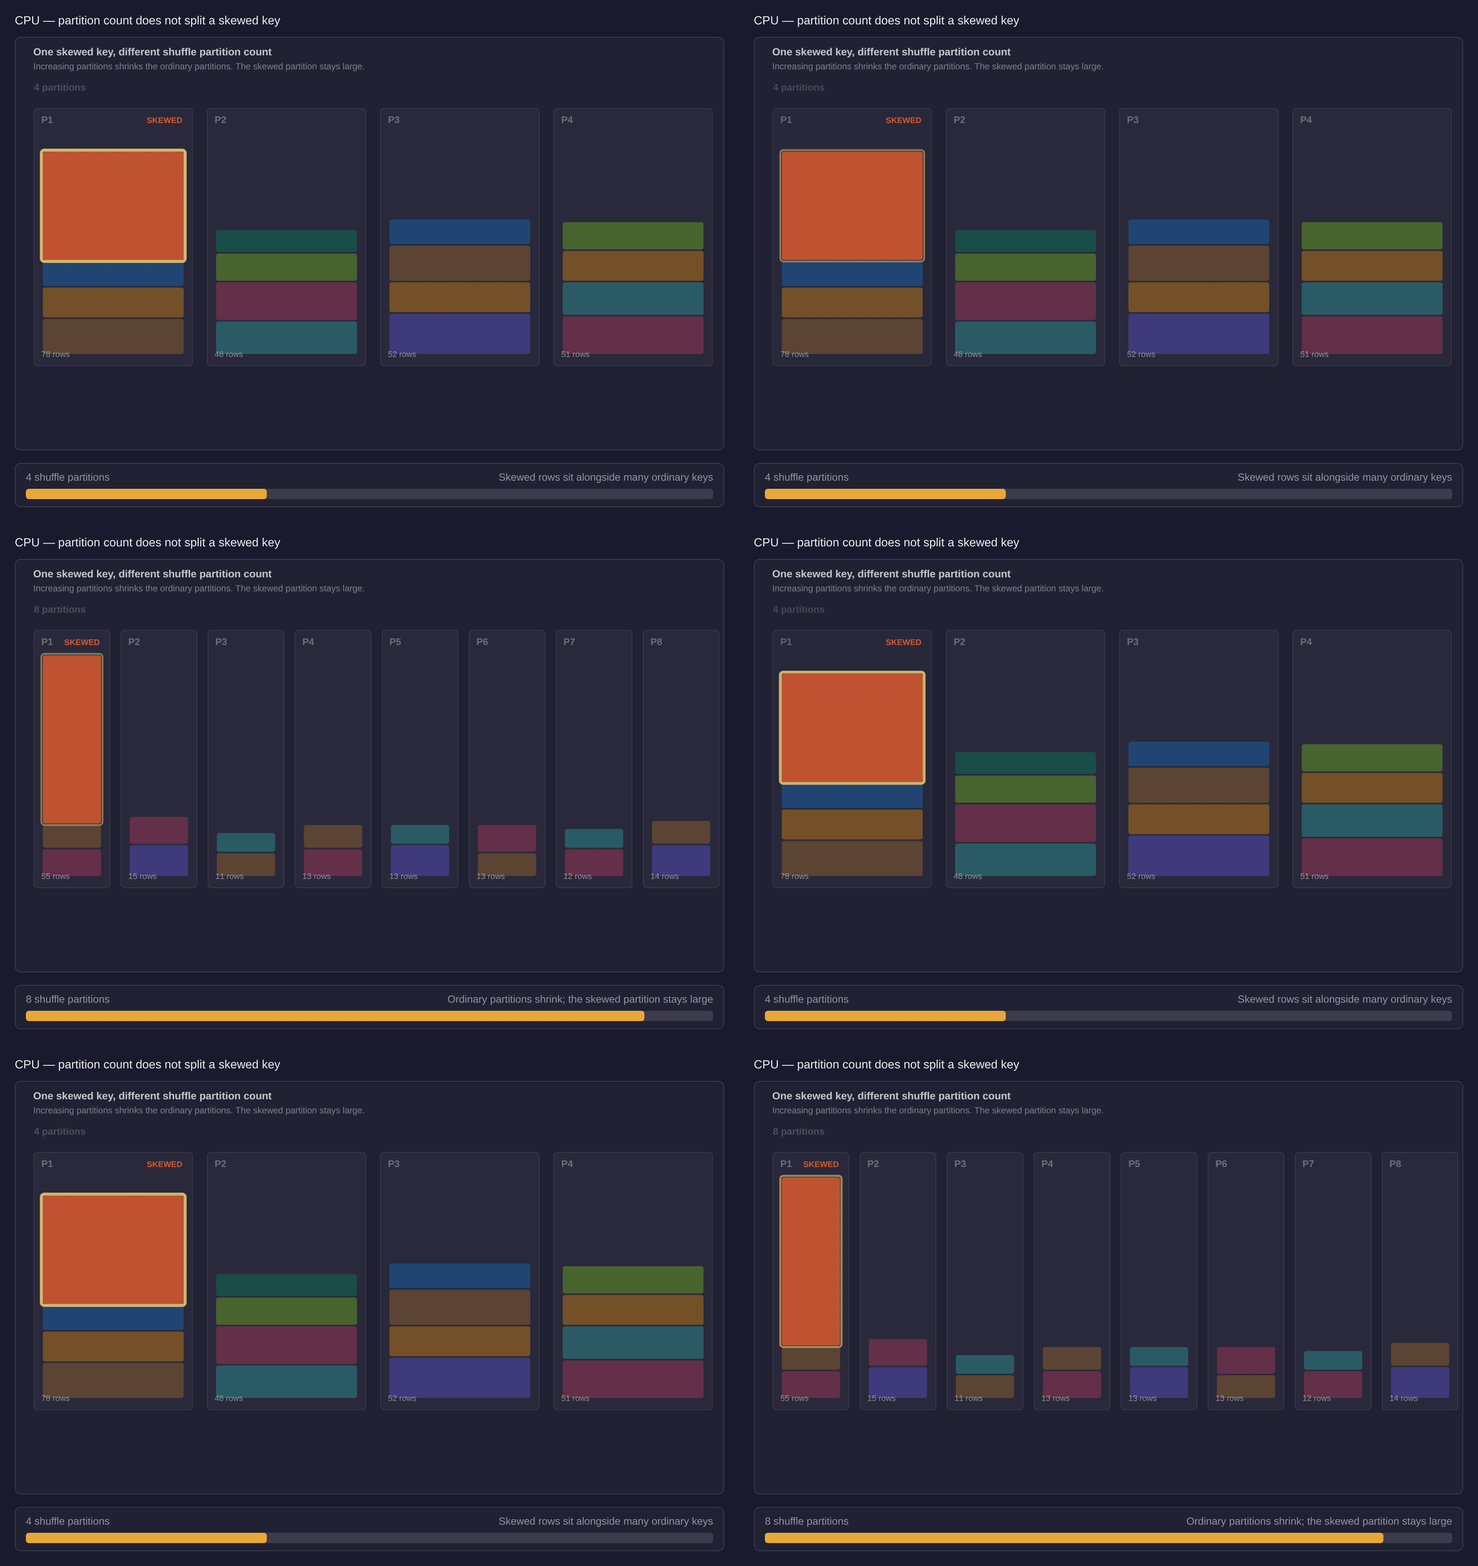
In Spark, the usual way to go faster is by adding more parallelism - more partitions, more tasks running at once. But Spark partitioning is a blunt tool for fixing hot-key skew. Most of the time, that instinct is correct. But partition count is a blunt tool for hot-key skew. Adding partitions subdivides the non-hot key space more finely, while the hot key remains concentrated in a single reducer. The average task gets smaller; the skewed ones might not.
The opposite adjustment - fewer partitions, so the hot key gets mixed in with more ordinary keys - does not make the hot key cheaper. It just buries the hot key inside a larger task while reducing overall parallelism, which can slow the job down.
The fundamental problem is that partition count is a single knob controlling two things at once: task size and concurrency. It cannot split a single hot key. One knob, two constraints, and only a narrow range satisfies both - a range that shifts every time the data distribution changes.
There is no gradual degradation here. A skewed partition does not take proportionally longer; once it crosses one of the executor's practical limits, performance drops sharply - far worse than the data volume alone would suggest. To make things worse, nothing in the query reveals which key will be the hot one, and the planner chooses its partition counts and JOIN strategies under the assumption the keys are evenly distributed. The result is that Spark performance can change dramatically as the data distribution shifts. A job running without issues for months can suddenly stall.
That is the real cost of data skew. Spark does supply some options: adaptive query execution can split skewed shuffle partitions in specific join cases, and teams can apply salting or skew hints. These are mitigations, however, not full solutions. Each one adds workload-specific logic, and another set of decisions to revisit as the data properties evolve with time.
What this looks like in practice: hot key join example
Consider a sort-merge join where the join key is a customer, account, or app ID, and both sides are event-style tables. Most keys have a manageable number of rows on both sides. One key is much “hotter” (more frequent) than the rest: the ID of a very large customer, a dominant app, or an account that represents most of the traffic.
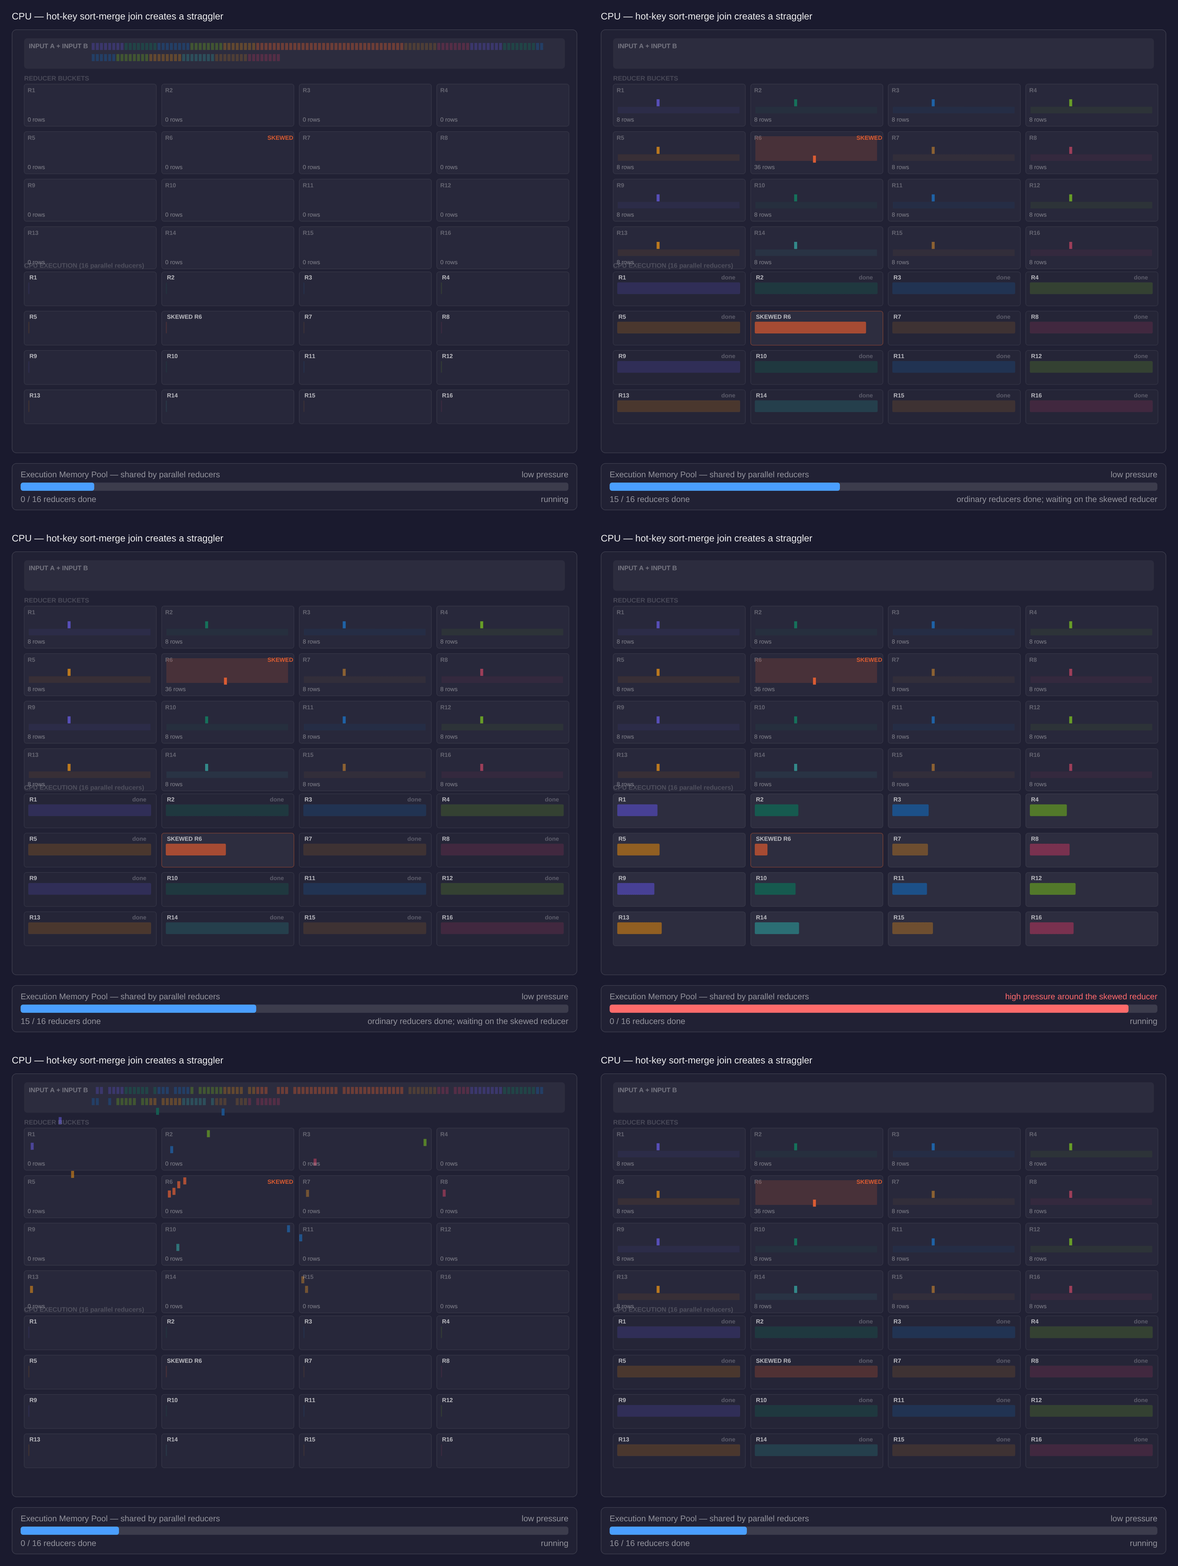
Spark first scans both input tables, then shuffles the rows by the join key so that matching rows meet on the read-side of the shuffle. For ordinary keys, each shuffle-reading task receives a manageable slice of both inputs. For the hot key, the shuffle-reading task receives every matching row from both sides – and if that key has a large number of rows on either side, the task has significantly more data to sort, compare, buffer, and emit than its peers.
If both sides carry many rows for the same key, the join produces the product of the two row counts, and the output for that key is genuinely large. That output cost is inherent - the query asked for those rows, and any engine would have to produce them. The skew tax is what that concentration costs the executor: the skewed task occupies one of the executor's concurrent task slots for far longer than its peers, so that core stays unavailable while the rest of the stage drains. What should be a balanced stage ends in a long tail, waiting on one task.
For anyone who has operated join-heavy Spark workloads in production, the pattern is familiar. The Spark UI shows most tasks completing within a tight band while several tasks stretch far beyond the rest. Then the Spark performance optimization cycle begins: increase or reduce shuffle partitions, salt the hot key, add skew-specific logic - and repeat.
DualBird architecture
Part 1 covers DualBird's architecture in greater detail. In short, each Spark executor accelerated by DualBird contains only a small number of Spark tasks and schedules them into a single FPGA pipeline, where each query operator runs through pipelined hardware data paths.
At any given moment, only a handful of tasks are active - each at a different step in the pipeline rather than having one task per CPU in a non-DualBird Spark executor. Because so few tasks are in flight simultaneously, each one has access to a much larger effective memory budget compared to the 1/N share it would receive in a CPU-based executor.
The natural concern is whether this trades one bottleneck for another: fewer concurrent tasks would mean lower throughput. This is not a problem, because to begin with, the FPGA pipeline processes data partitions orders of magnitude faster than any general-purpose CPU would. DualBird does not need the same degree of executor-local concurrency to reach high throughput.
How the issues dissolve
1. Disk spills
The skewed Spark partition spilled to disk when it needed more memory than its 1/N share allowed. In DualBird's FPGA pipeline, only a handful of partitions are live at once, so each active partition has a significant larger memory budget. On-board memory is still finite, but the threshold is far beyond the practical executor memory limit that turns data skews into disk spills in CPU-based Spark.
2. Stragglers
In CPU-based Spark, data skew produces a straggler because many peer tasks run side by side. Most tasks finish, the skewed task remains, and executor resources sit idle until it completes. Execution time becomes sensitive to the largest partition.
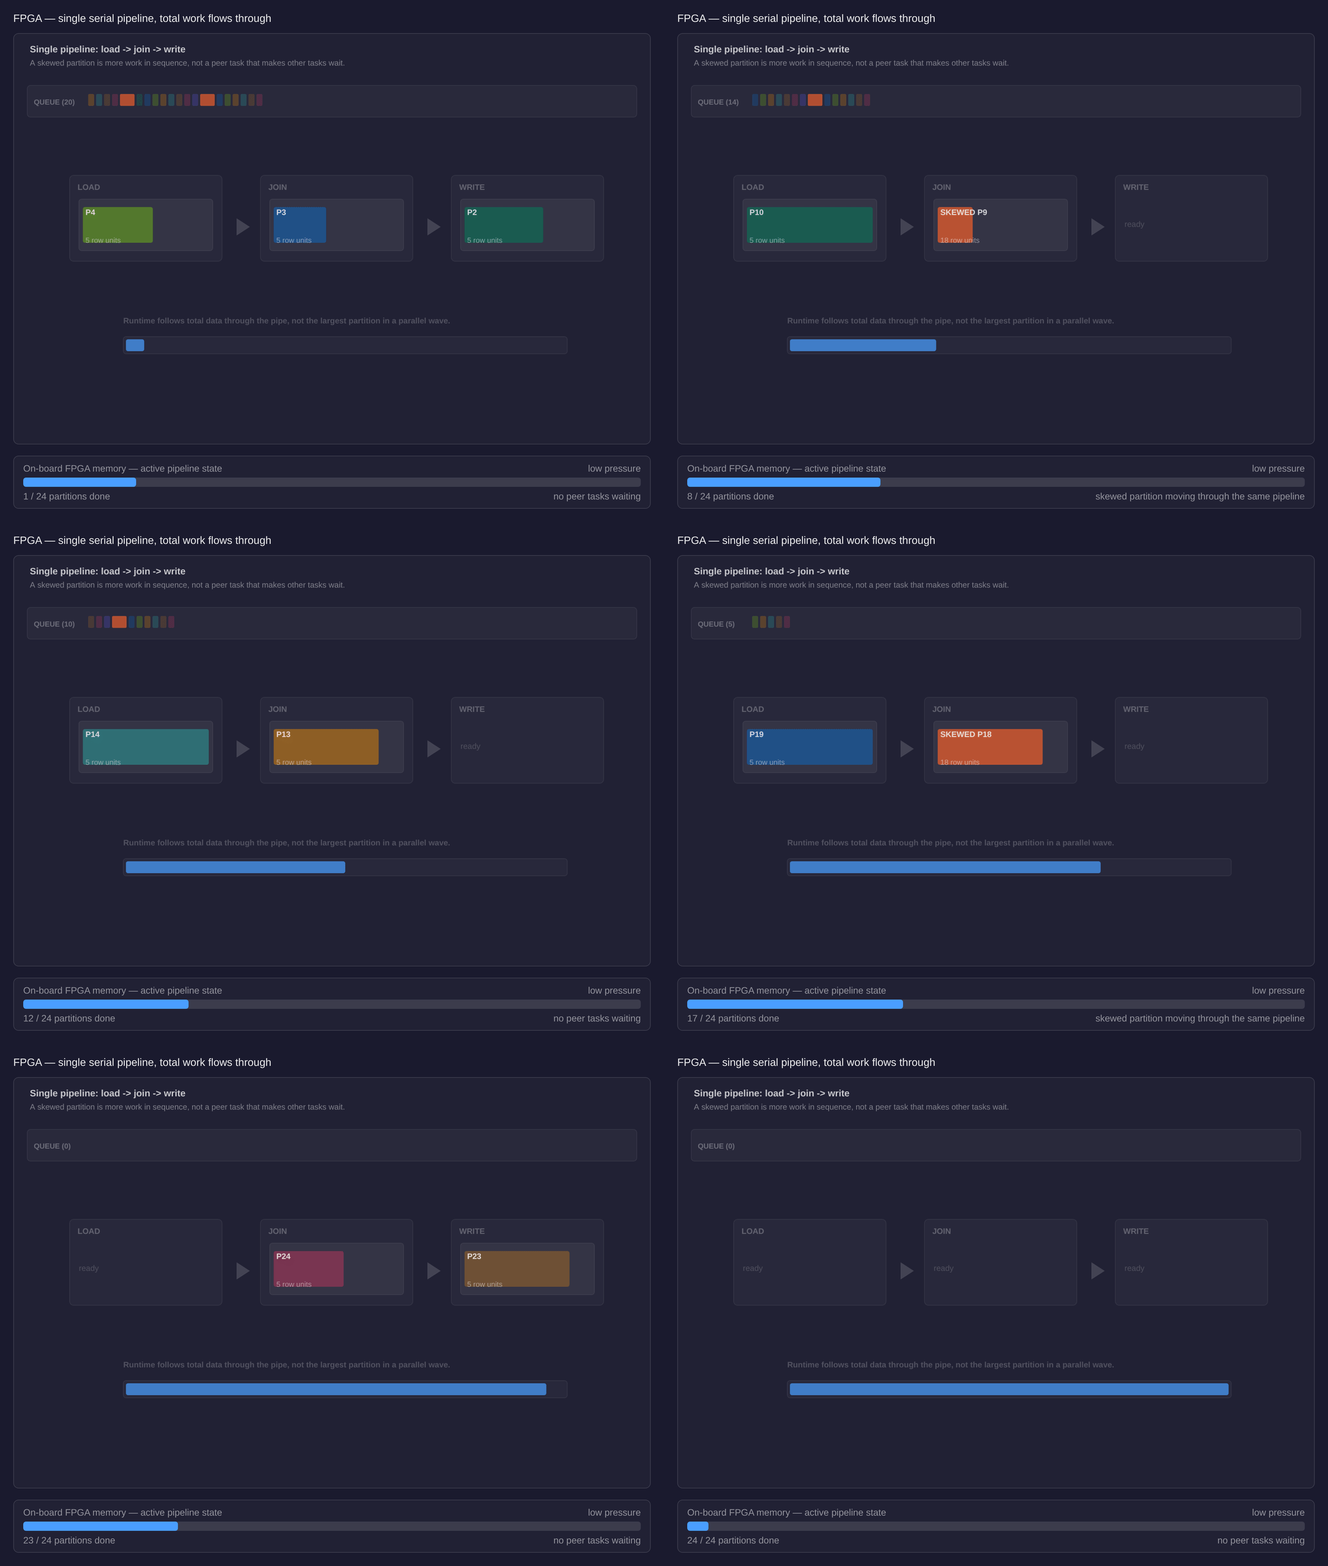
DualBird changes that regime. Each executor has a single FPGA pipeline: Spark tasks pass through the same pipeline one after another, with only a few tasks in flight, occupying different stages of the pipeline. Execution time is sensitive to the total data volume moving through the pipeline. A skewed task may take longer than the average task, but it does not create the executor-local straggler pattern: no CPU cores sit idly waiting on it because they have no other tasks to run in the meantime. Another way of viewing the stragglers issue is through the following example: When only 2 cores are active in an 8-core executor (because these 2 cores are running large, skewed tasks), that executor is down to roughly 1/4th of its potential throughput, yet its hourly cost remains proportional to full 8 cores. DualBird executor on the other hand can maintain full throughput even when only 2 tasks are available to the executor, and that base throughput is disproportionally high to begin with.
3. The tuning trap
In unaccelerated, CPU-based Spark, the cost of data skew is nonlinear and difficult to predict, so teams tune defensively and re-tune whenever the data distribution shifts. On the FPGA pipeline, the executor no longer has the same practical skew cliff; the threshold where a large skewed partition would exceed local memory is pushed far past the point where CPU executors normally spill, thrash, or stall. There is no partition-count tightrope to walk just to keep the hot key from turning into an operational incident.
You no longer need to choose partition counts to avoid executor-local skew behavior, nor rely on salting and repartitioning for those workloads. Instead, you can set partitions for ordinary reasons, such as output file size or desired parallelism, without treating data skew as an operational risk.
Skewed join example revisited
With DualBird’s architecture, the join runs on a hardware join engine in the executor's single FPGA pipeline. The hot keys are still there, still representing more input rows, more matching work, and possibly a very large output. However, the performance issues associated with data skew do not manifest in the same way.
The result is not that the data becomes evenly distributed - it is that the uneven distribution no longer translates into executor-local instability. The hot keys are simply more data being processed in the FPGA pipeline, rather than a hidden data property that nonlinearly changes how the executor behaves.
A few partitions move through different stages of the same FPGA pipeline using on-board memory; the hot key takes longer to process, without executor-local peer tasks competing with it for memory and cores.
Transform your data infrastructure performance with a few clicks
Zero risk, zero effort, incredible results.